


Summary: On Heroku, Rails scales fairly easily, but there are some important things to consider. We looked at how various dyno and Postgres settings effect overall performance on Heroku.
##Why Test Scaling?
ZeeMee’s servers are going to receive an onslaught of requests during the coming college admissions season this fall. Because ZeeMee allows students to add videos and photos to their college applications, our web service load is very cyclical. At the peak hour (the college application deadline) our requests load is 150x our average load.
In preparation for this fall, we wanted to be well prepared for bursts of API requests, so we decided to see how far we could stretch performance on Heroku. Our app serves up a POJA (plain old JSON API) and a GraphQL endpoint. Our web and mobile apps query these API’s for reads and writes.
Note: We measured in requests-per-minute instead of requests-per-second because this is the metric reported by various tools we were using (New Relic, Flood IO). We also realize that 125k rpm can easily be surpassed when using other, high performance languages/technologies/etc. We simply wanted to see how far we could take our Rails app without a major technology change.
##Methodology
As a first step, we measured what an “average user” did while they built out their ZeeMee. Roughly, a ZeeMee user does the following:
- Create an account
- Upload a profile photo
- Fill out several activities
- Add several photos and a video to each activity
- Use site search a few times and drill down a few pages of results
- Edit their activities several times
- Rearrange photos and videos
- Give shoutouts to friends
- Sign back in, and do the above things a bit more
We took this average user profile and turned it into a JMeter script with jmeter-ruby. We then used Flood IO to run the script with lots of concurrency against a staging - - ZeeMee web service. At the beginning of the tests, Flood IO was able to easily overwhelm our Heroku app, while toward the end it seemed like the way we used Flood IO was the bottleneck rather than Heroku (more details about this further down).
While running the tests, we measured Requests per Minute (RPMs), response time, dyno loads, and database loads (CPU, IOPS, memory), including instrumenting the servers with New Relic and Heroku’s metrics features.
The code base stayed mostly the same throughout the test. We only modified our code base one time to address the “Test 16 Issue”. We also added PgBouncer when the number of web workers exceeded the maximum connection count on the Postgres database. Other than that, the Rails code was untouched between runs. So, these results should be a descent proxy to determine how an arbitrary app would scale as you throw more hardware at it on Heroku.
##Results
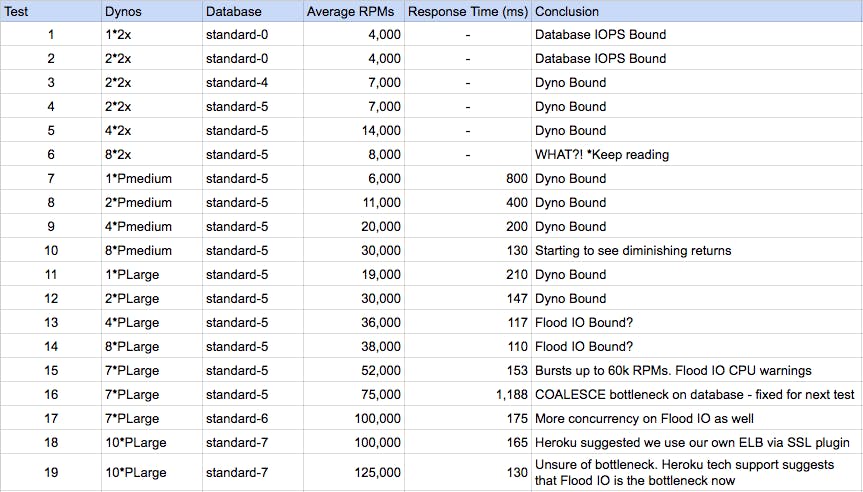
Test 1–5 scaled up as expected as we increased dyno count and database hardware.
Test 6 was very important — it made no sense at all! We doubled the number of dynos and got half the throughput. We figured out that two of the dynos happened to be cohabited with really busy dynos from other Heroku customers. Our dyno instances appeared to have low CPU utilization even though the hypervisor was slammed. Figuring this out was like trying to look outside of the Matrix from within. There were hints, but nothing concrete. Ultimately Heroku support confirmed our suspicions.
An important outcome of these tests is that the slow-response situation is outside of your control unless you’re running single-tenant (performance) dynos.
Even worse, however, is that due to the random-routing algorithm Heroku uses for load balancing, a single slow dyno brings the entire app to its knees. It’s well-known that intermixing fast and slow response times in a single Heroku app wreaks havoc on overall app performance. An important outcome of these tests is that the slow-response situation is outside of your control unless you’re running single-tenant (performance) dynos — noisy neighbors cause the same problems as intermixing slow and fast queries.
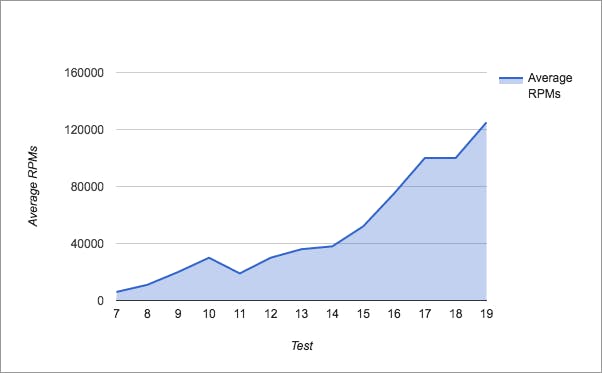
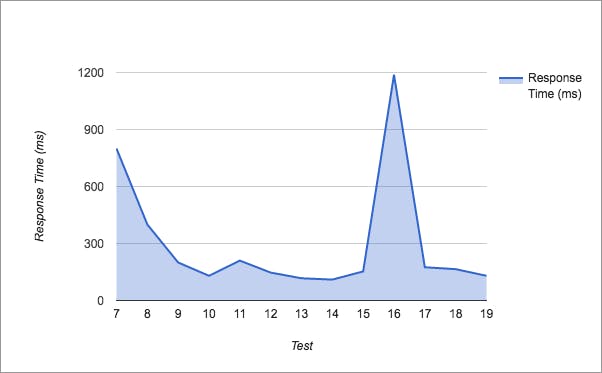
After test 7, where we got past the multi-tenancy issue, things went well. Overall, we’re happy with Heroku’s performance. For the most part, things scaled linearly as we added hardware, although there were diminishing returns after a while. (Test 16 was an anomaly that was easily addressed by improving a particular SQL query).
Eventually, we reached the point where our setup on Flood IO was the weakest link rather than Heroku. We’ll likely do further tests with a more distributed Flood setup and we’ll provide an update when that time comes.
##Checklist for Scaling on Heroku
In conclusion, if you want to scale your Rails app on Heroku, keep the following in mind:
- Watch your database IOPS. We hit the limit here before we hit CPU or memory limits, which was a surprise.
- Eventually, you’ll need PgBouncer so that you don’t max out the number of connections to Postgres (limited to 500 for bigger database plans). To get an estimate, multiply your number of dynos by the concurrency per dyno. We had 67 processes running on each of 10 P-Large dynos, so 67*10=670 was more than 500 connections allowed to Postgres.
- Move to single-tenancy (P-medium or P-large) dynos sooner than later. Not only does this put control back in your hands, but response times drop and variation is reduced after making the switch.
- Instrument the app with New Relic, and use Heroku’s Metrics feature to measure the bottleneck.
- Use Heroku’s support — they are extremely technical and can figure stuff out that you cannot see. They sent me performance graphs, detailed diagnostics, etc — top notch!